Last update - 6/19/2005
Many experiments have been conducted to test the application of multispectral radiometry for measuring severity of foliar diseases of barley and their effects on yield and quality. In all of these experiments it was found that remote sensing using the radiometer was much more efficient and accurate for estimating severity of disease than the conventional visual rating methods. The radiometer is also more effective for estimating the loss in yield due to different levels of disease than is the plot combine. The radiometer is also useful for estimating the efficacy of different rates and timing of fungicide application and for screening of experimental fungicides in field trials.
| |
|---|
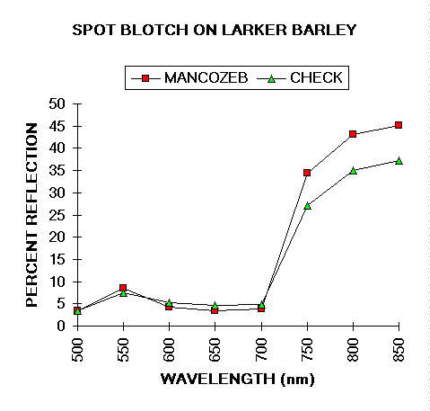
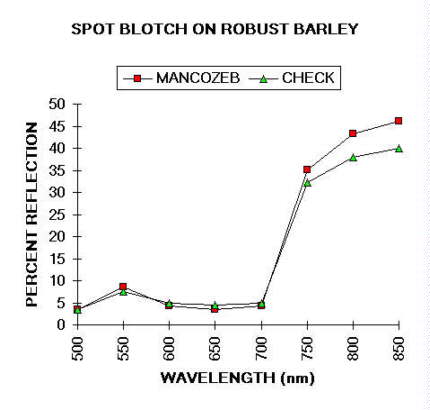
Fig. 1. Comparison of percent reflectance of 8 wavelengths from canopies of Larker and Robust barley cultivars at the soft dough stage of development. Larker is suseptible, Robust is partially resistant to Spot Blotch.
 |  |
|---|
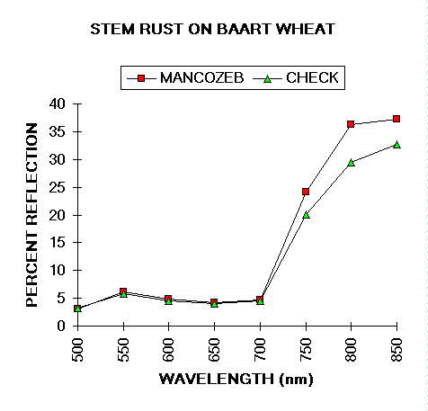
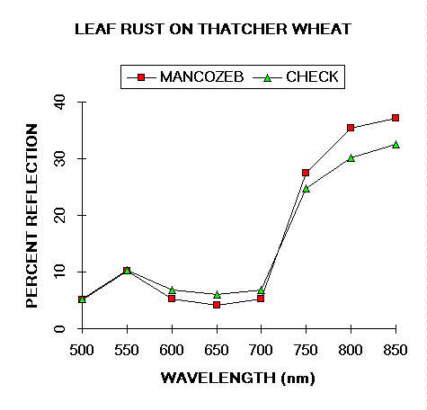
Fig. 2. Percent reflectances of 8 wavelengths from canopies of Baart wheat suseptible to Stem Rust and Thatcher wheat susceptible to Leaf Rust.
Based on results from experiments using the cultivar Larker, susceptible to spot blotch, models were developed (Dr. Vernyl D. Pederson, Plant Pathologist, North Dakota State University, based on data collected by Dr. F.W. Nutter, Jr., see references) to estimate yield and quality loss due to different levels of disease (Fig. 3 and Table 1 below).
 |
|---|
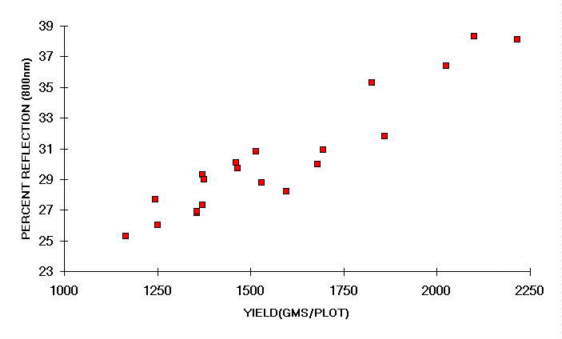
Fig. 3. Relationship between yield and percent reflection of 800 nm wavelength for 20 plots. Treatments are fungicide applications and 4 levels of inoculation with the spot blotch organism. The four fungicide treated plots are in the upper right section of the scatter diagram.
Table 1. Using an 8 narrow waveband regression model to estimate YIELD from Larker barley protected by fungicide or inoculated with 4 levels of the Spot Blotch organism.
| Treatment* | Combine Yield (GMS) | Yield (GMS) |
|---|---|---|
| |
|
|
| |
|
|
| |
|
|
| |
|
|
| |
|
|
Table 2. Using an 8 narrow waveband regression model to estimate percent YIELD LOSS from Larker barley protected by fungicide or inoculated with 4 levels of the Spot Blotch organism.
| Treatment* | Percent Observed | Yield Loss Estimated |
|---|---|---|
| |
|
|
| |
|
|
| |
|
|
| |
|
|
| |
|
|
The model based on the reduction in percent reflection of 800nm due to disease is: Y = 3.1 X The model states that for every 1% reduction in percent reflection of the 800nm wavelength, there is a 3.1% yield loss.
Simple models may be developed for quality factors such as percent plump seed. Models for seed protein content and other malting quality factors will undoubtedly require inputs from climatic data, soils data and inputs from analysis of percent reflection of other wavelengths of the spectrum. These will not be simple linear regression models, but will be models derived from multiple regression and other statistical techniques. Once the models are derived by experimental methods they will need to be tested over different environments at various locations using several cultivars or selected barley lines.
Once the models are tested and are proved to be reliable, practical applications may be made of them in the field. Basic automated environmental data collection stations could be strategically located throughout the major barley production areas. Certain aspects of remote sensing could be used as well as timely and significant inputs from the growers. This data can be automatically downloaded to the central computer facility in a timely manner where expert systems will generate appropriate information to interested parties as well as feed-back to the grower.
References to Publications/Presentations based on the use of CROPSCAN, Inc. MSR Systems
 CROPSCAN, Inc. Home Page
©2017 CROPSCAN, Inc.
all rights reserved