Last update - 9/9/2002
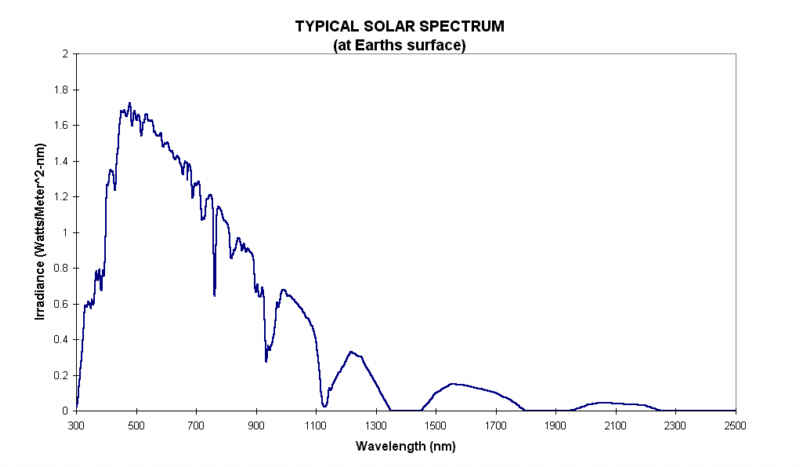
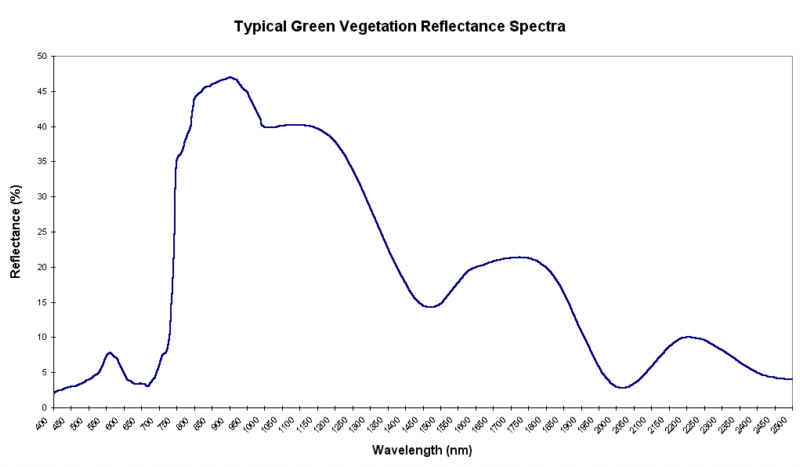
Following are typical spectral curves for incident solar irradiance, green vegetation reflectance, photodiode response, and some interference filters used in CROPSCAN, Inc. radiometers.
Solar Irradiance Spectrum (typical):
Green Vegetation Reflectance Spectra (typical):
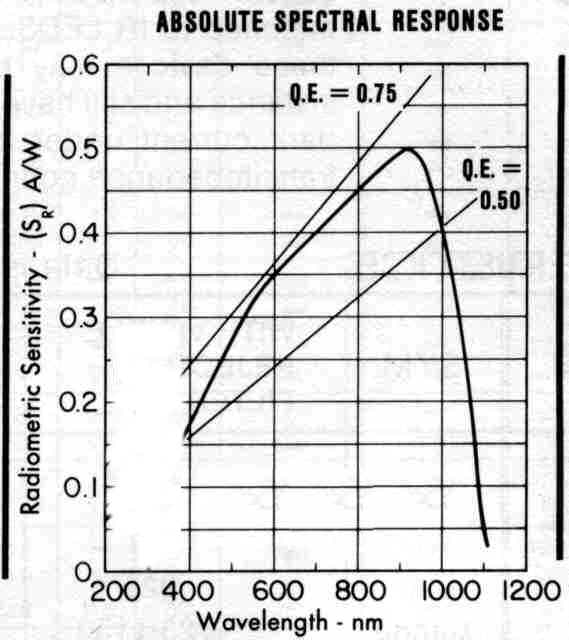
The following are typical spectral response curves of the Silicon and Germanium photodiodes used in the CROPSCAN, Inc. Multispectral Radiometers (MSR). Silicon photodiodes are used for bands with center-wavelengths in the 450-1080 nm range. Germanium photodiodes are used for bands with center wavelengths in the 1100-1720 nm range.
The photodiode output is electrical current. This current is converted to voltage and amplified before being sampled by the CROPSCAN, Inc. Data Logger Controller (DLC).
Silicon Photodiode Spectral Response (typical, used for bands in the 450-1080 nm range):
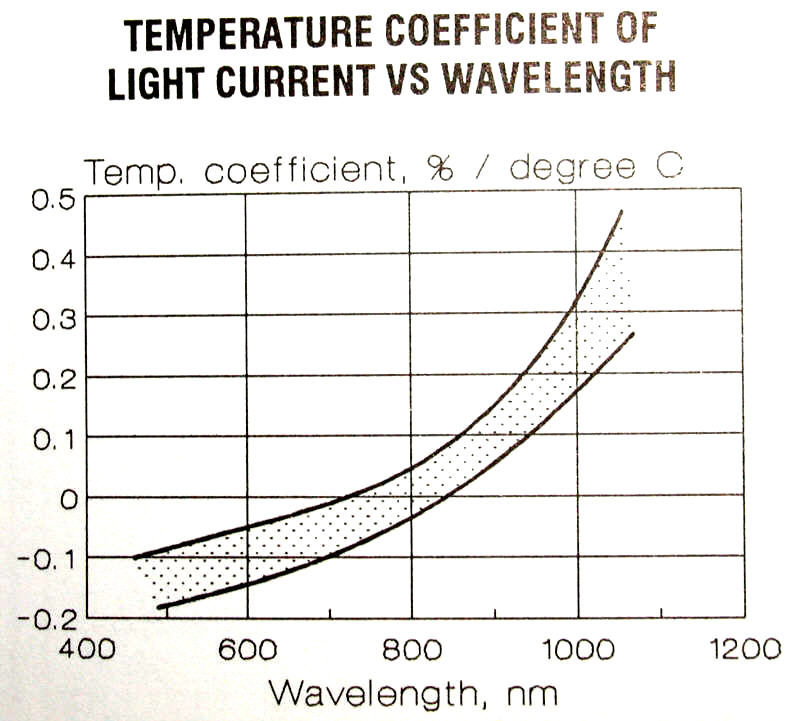
Silicon Photodiode Spectral Temperature Sensitivity Response (typical, used for bands in the 450-1080 nm range):
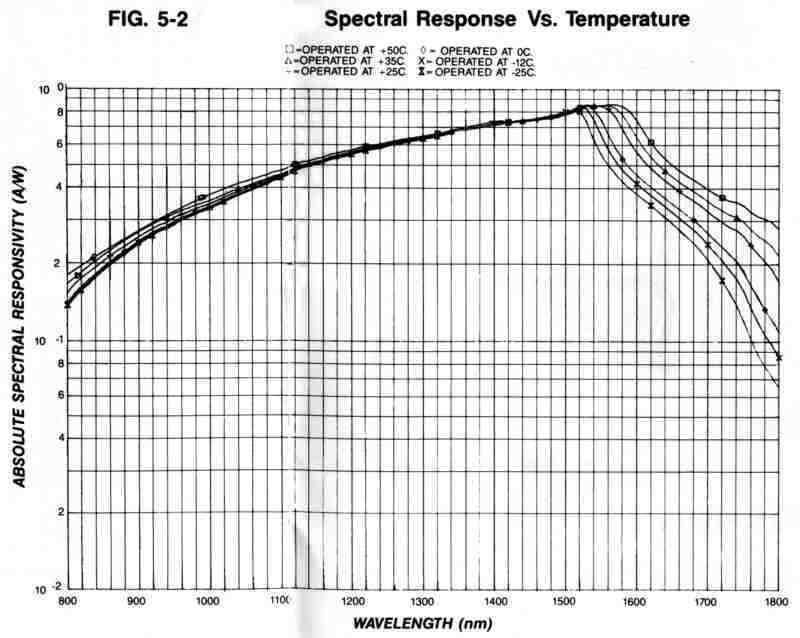
Germanium Photodiode Spectral Response (typical, used for bands in the 1100-1720 nm
range):
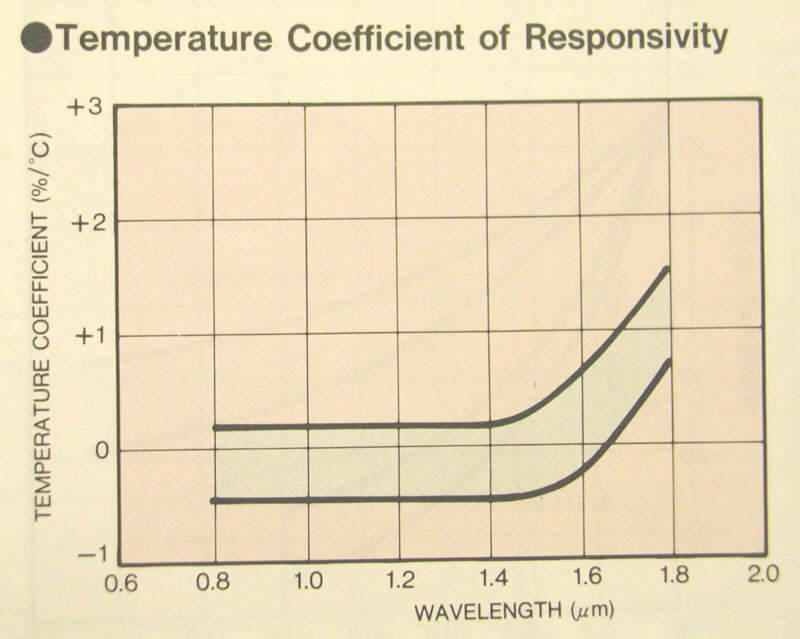
Germanium Photodiode Spectral Temperature Sensitivity Response (typical, used for bands in the 1100-1720 nm range):
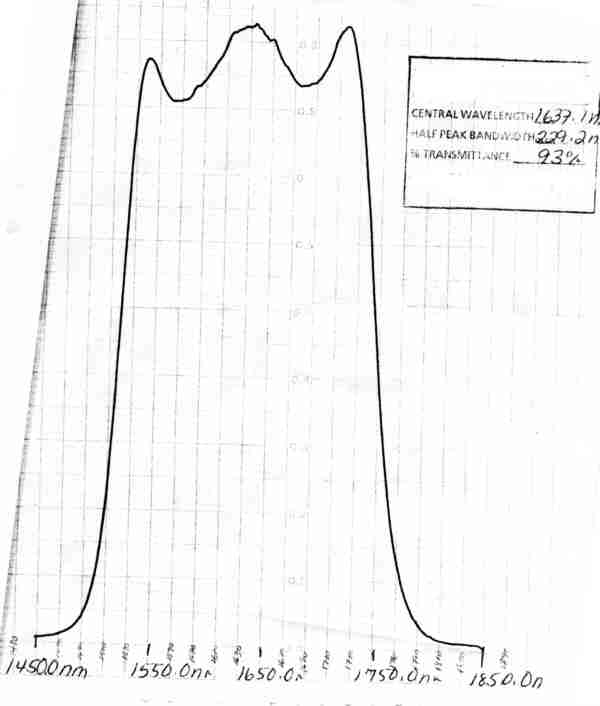
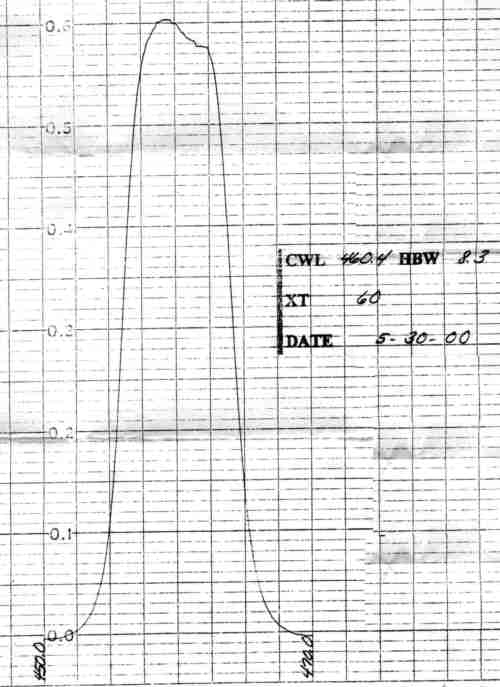
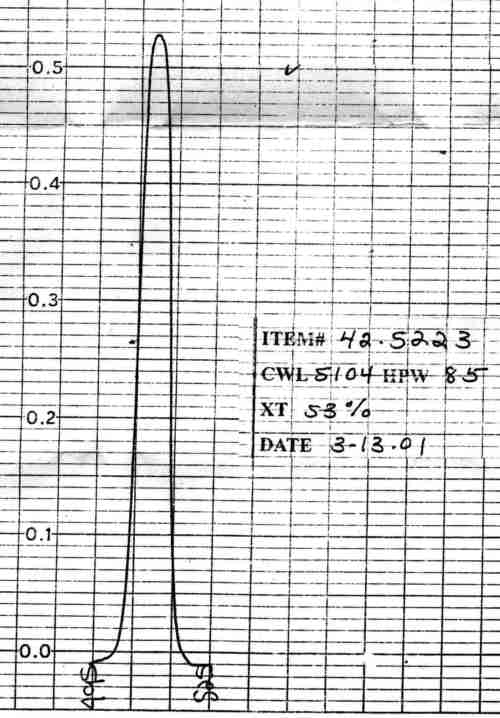
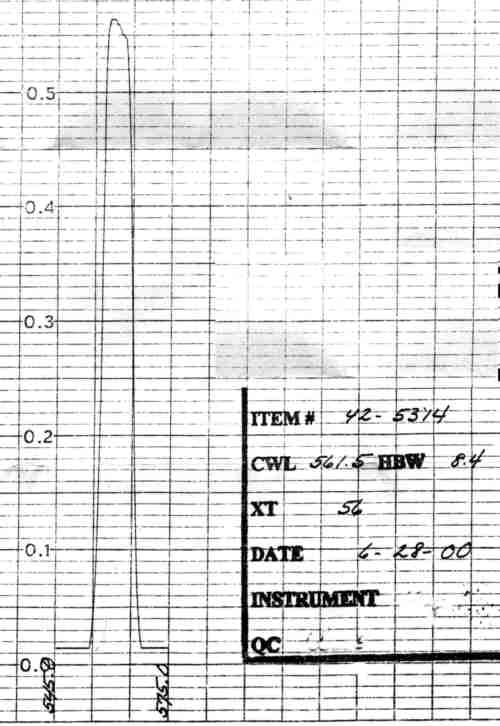
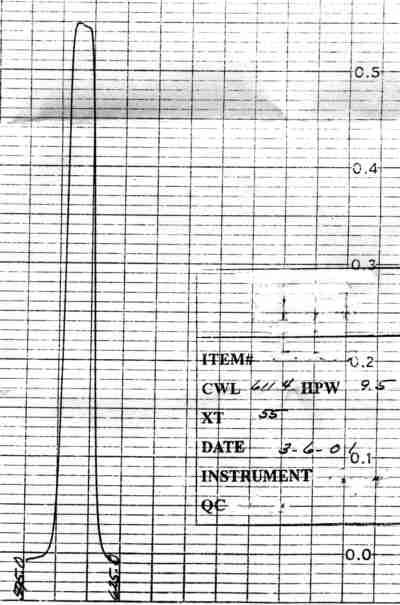
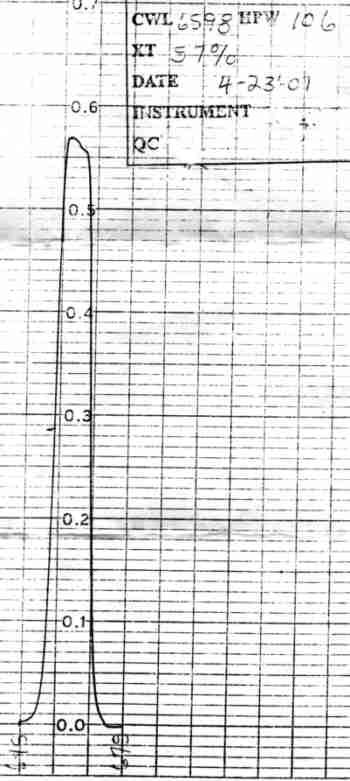
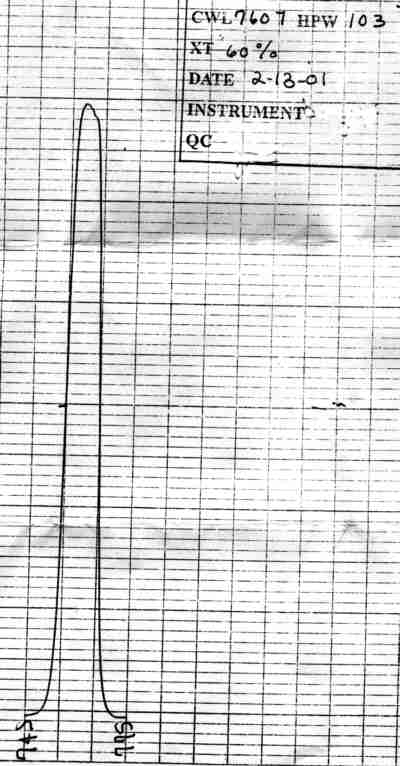
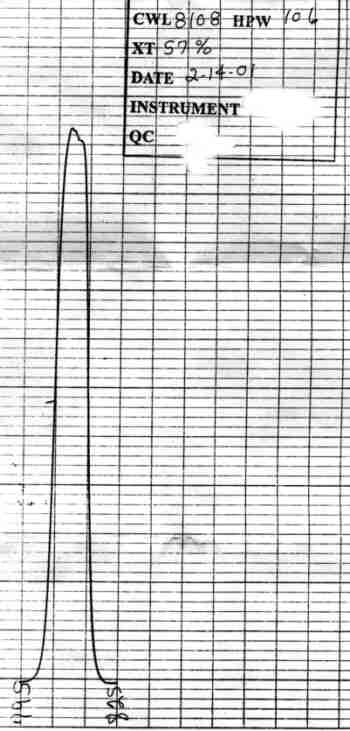
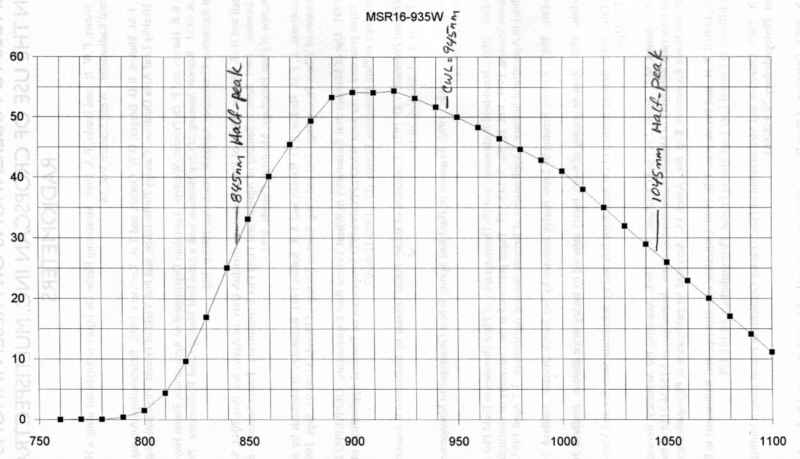
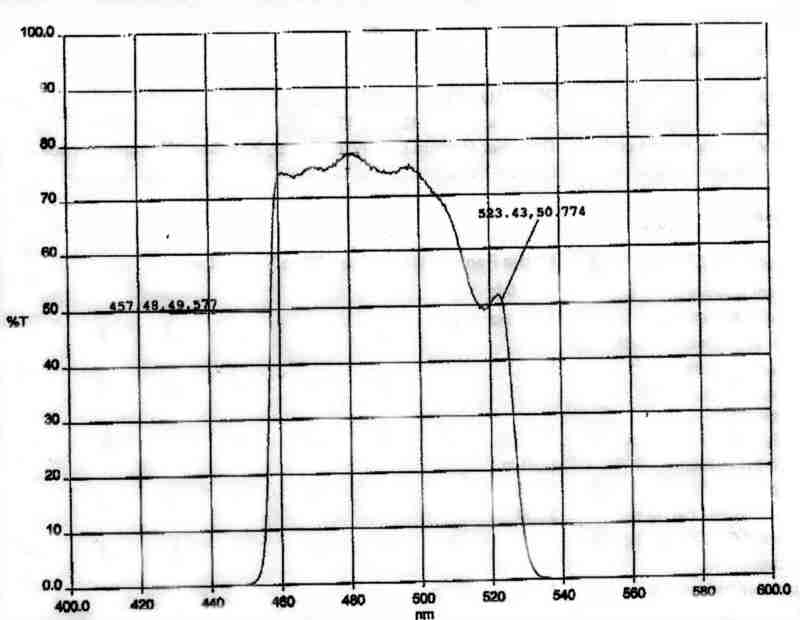
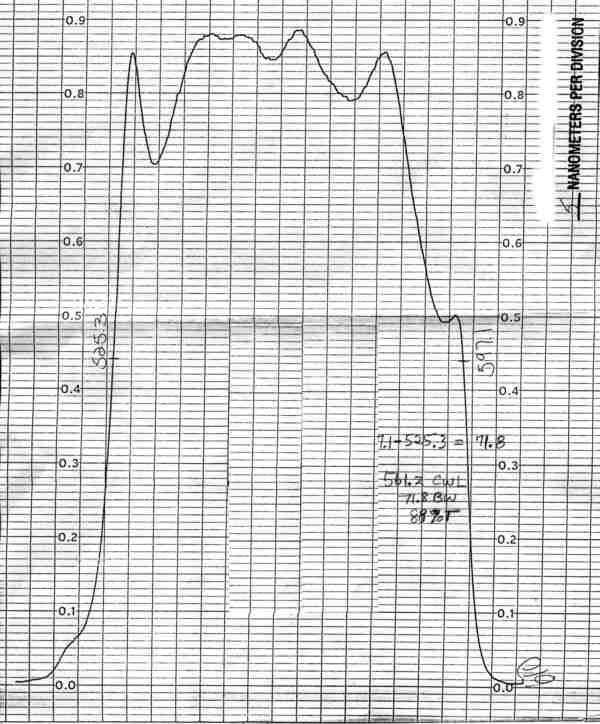
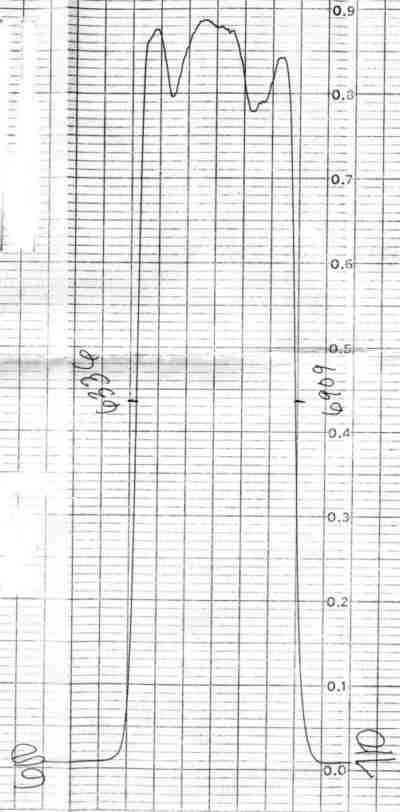
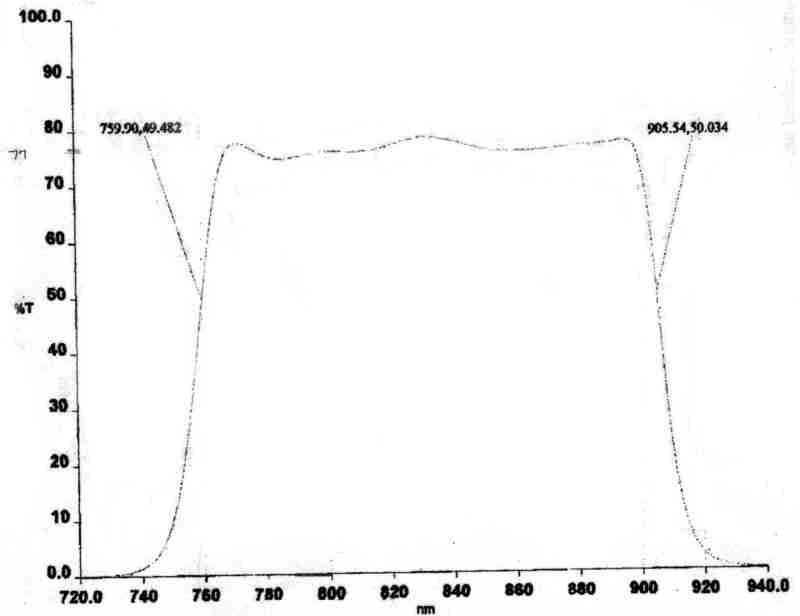
FILTER CURVES (typical):
460 nm:
510 nm:
560 nm:
610 nm:
660 nm:
710 nm:
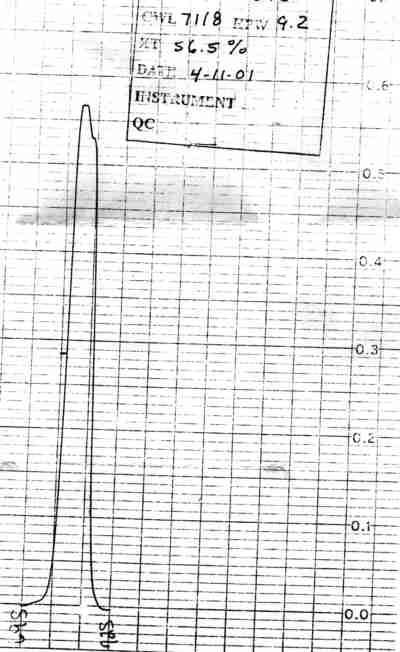
760 nm:
810 nm:
935W nm:
485 nm (TM):
560 nm (TM):
660 nm (TM):
830 nm (TM):
1650 nm (TM):